Bulls Eye $80K, Bears Push Back: What Could Break Bitcoin’s Most Stubborn Wall?
- Views: 3
This post was originally published on this site
Bitcoin is knocking on the door of $80,000 — again. And the bears are not letting it through without a fight.
As of this morning, BTC is trading just above $80,000, having briefly breached that level over the weekend before pulling back into a tight consolidation range. The psychological barrier has become the most-watched price level in crypto, and for good reason: everything that happens at $80,000 over the next two weeks could define the trajectory of the entire market through mid-2026.
This is not a simple story of bulls versus bears. It is a story about who blinks first — the institutions quietly loading the boat, or the short sellers who have crowded into one of the most lopsided positioning setups seen on any major crypto derivatives platform this year.
The Wall That Won’t Break
Let’s be blunt: $80,000 has been a graveyard for bullish momentum. The 200-day moving average sits at $82,228, and Bitcoin has not closed above that level since October 2025 — the same month it hit its all-time high of $126,000. Every rally attempt since February has been met with selling pressure at or just below this zone, creating a ceiling that has frustrated bulls for months.
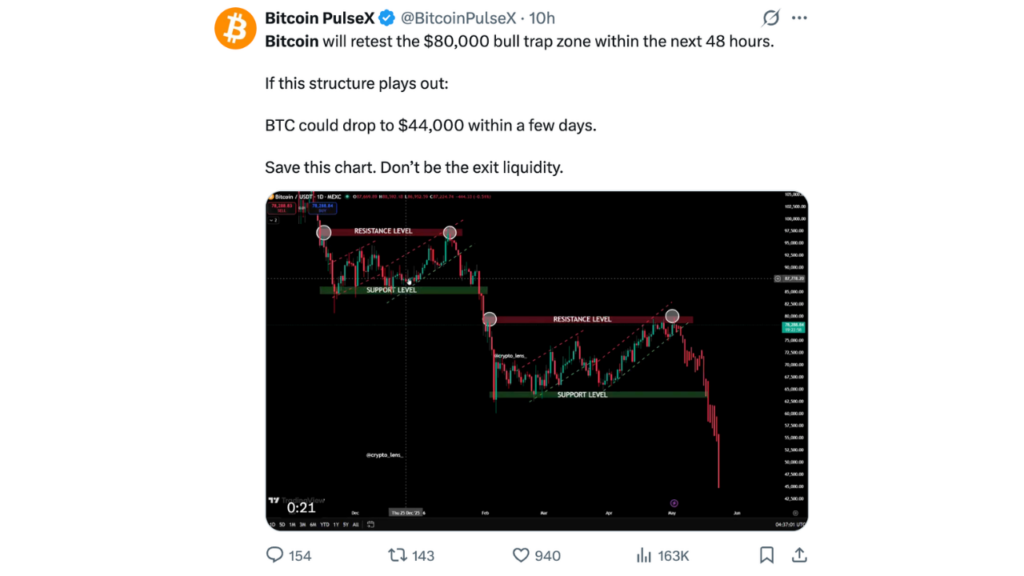
The technical picture tells the story clearly. On the daily chart, Bitcoin has formed a consistent pattern of higher lows since bouncing off the $60,061 February low — a textbook recovery structure. But higher lows mean nothing without higher highs, and the $80,000–$82,000 supply band has refused to give way. On the four-hour chart, an upward channel has been intact since early April, with the upper boundary clustering exactly where every informed trader is watching: $79,000–$80,000.
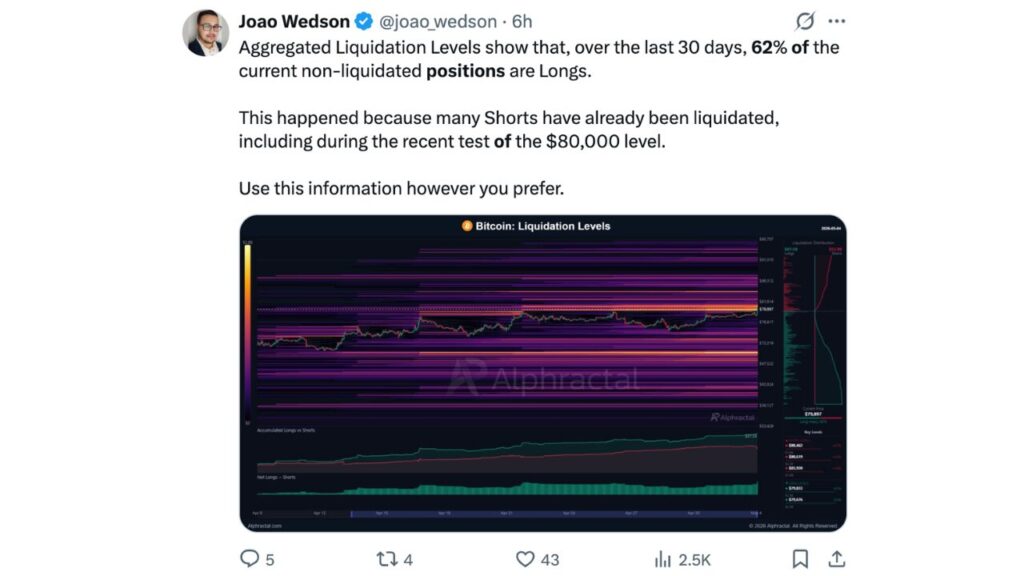
Short sellers know this. Binance futures data shows the long/short ratio sitting at 37.2% long versus 62.8% short — among the most lopsided positioning on any major crypto derivatives platform. Analyst Gareth Soloway warned on May 3 that a bear flag pattern could push Bitcoin toward $50,000 if it fails to clear $85,000, and that thesis has attracted heavy short interest heading into this week’s session. The bears are not positioned here by accident. They are betting this wall holds.
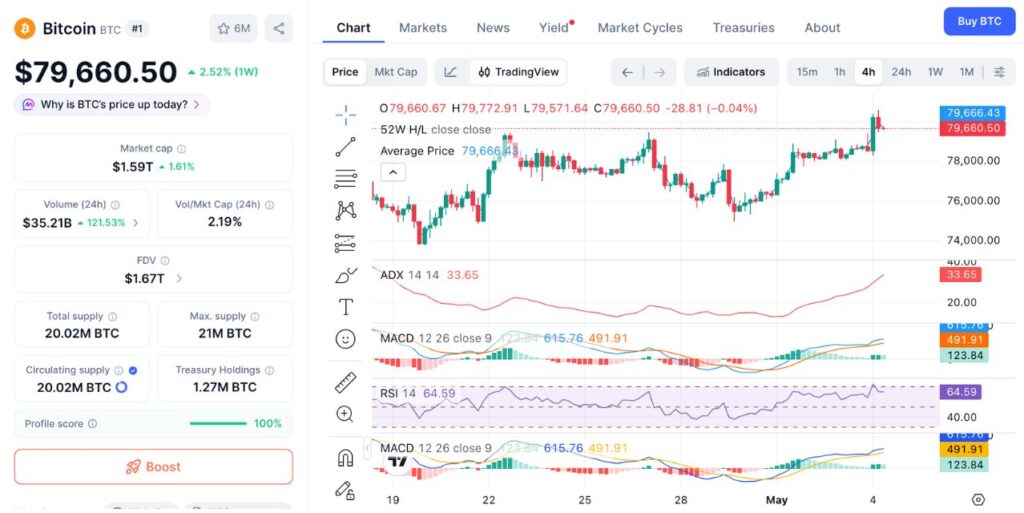
Bitcoin rises above $80,000 for the first time since January 31st. (Source: CoinMarketCap)
What the Bulls Have Going For Them
But here’s where the narrative gets complicated — and compelling.
The smart money is not running away. It is accumulating.
On May 1 alone, U.S. spot Bitcoin ETFs recorded $629.8 million in net inflows, one of the strongest single-day performances for the asset class in 2026. BlackRock’s iShares Bitcoin Trust led the charge with $284.4 million, followed by Fidelity’s FBTC with $213.4 million. Together, those two firms accounted for over 79% of a single day’s capital entering the sector. This follows an April that was the strongest month for Bitcoin ETF inflows since October 2025, with the sector collectively adding $2.44 billion.
Let that number sink in. In a month where Bitcoin was grinding below $80,000 and sentiment was cautious, institutions were funneling billions of dollars into spot Bitcoin products. BlackRock now holds over 810,000 BTC and manages more than $50 billion in Bitcoin-related assets. These are not tourists. These are pension funds, wealth advisors, and long-term capital allocators who view $78,000 Bitcoin as a buying opportunity, not a warning sign.
On-chain data reinforces this picture. Whale wallets net-bought 270,000 BTC in April alone. Exchange reserves have hit a 7-year low — meaning Bitcoin is being pulled off exchanges and into cold storage at a rate not seen in nearly a decade. When coins leave exchanges, they are not available for immediate sale. Supply is drying up precisely as demand is picking up.
Research firm Capriole Investments flagged a particularly striking demand signal: institutions are currently absorbing more than 500% of the daily mined Bitcoin supply. In every prior instance where this metric reached similar levels, Bitcoin returned an average of 24% over the following month. At today’s price near $80,000, that would imply a move toward $96,000.
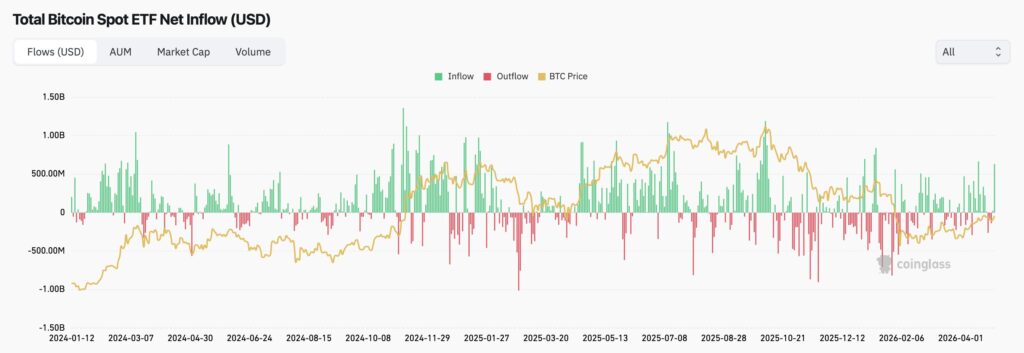
Total Bitcoin Spot ETF Net Inflow (USD) (Source: Coinglass)
The Short Squeeze Sitting in Plain Sight
There is an accelerant loaded into this market, and most retail investors are not paying close enough attention to it.
With 62.8% of Binance futures positions sitting short, the market has effectively set a trap — potentially for itself. When Bitcoin briefly broke above $80,000 over the weekend, over $150 million in short positions were liquidated in a single hour. That cascade was merely a preview. The real squeeze has not happened yet.
Here is the mechanics of what bulls are banking on: as price pushes above $80,000, short sellers face margin calls and are forced to buy Bitcoin to cover their positions. Those forced purchases drive the price higher, which triggers more liquidations, which drives price higher still. This is a short squeeze, and the current positioning data suggests the fuel for one is already in place.
Nick Ruck, director of LVRG Research, told Block: “The quick shift places near-term momentum firmly as bullish and confirms buyer strength after the earlier pullback.” Dominick John of Zeus Research described the move above $80,000 as a “technical short squeeze” as price breaks through a major psychological resistance zone.
Sean McNulty, Asia-Pacific derivatives trading lead at FalconX, went further, saying that institutional activity in the derivatives market suggests “high conviction in a move toward $85,000 by mid-month.” Caroline Mauron, co-founder at Orbit Markets, added that a decisive break above $80,000 would provide “further positive momentum to the asset class.”
The Short Squeeze Sitting in Plain Sight
The Macro Wildcards
Bitcoin does not exist in a vacuum, and right now the macro environment is throwing curveballs from multiple directions.
The Federal Reserve held rates steady at 3.50%–3.75% this week, but the decision came with an unusually fractured FOMC — four dissenting voices, the most since 1992. One governor pushed for a cut; three regional presidents opposed further easing. That kind of internal division is not a signal of stability. It is a signal of transition, and markets hate uncertainty.
Jerome Powell’s chairmanship ends on May 15. Kevin Warsh, who succeeds him for the June FOMC meeting, is known for favoring tighter monetary policy. If Warsh signals hawkish continuity, that could weigh on risk assets including Bitcoin. Conversely, any pivot toward accommodation would likely light a fire under BTC.
Geopolitics add another layer. The U.S.-Iran conflict and the closure of the Strait of Hormuz have kept oil prices elevated above $100 per barrel. Energy inflation feeds into broader inflation readings, which complicates the Fed’s path. Yet the same uncertainty that spooks equity markets has historically driven capital toward Bitcoin as a non-sovereign store of value — the same logic that has pushed gold to new highs throughout 2026.
Stablecoin legislation in the U.S. Senate has also caught the attention of crypto traders. Optimism around a deal on a key stablecoin yield provision, potentially clearing a path for sweeping crypto legislation, has quietly lifted sentiment. Richard Galvin, executive chairman at DACM, called it “early days” but acknowledged that $80,000 “has been a big psychological barrier” — one whose breach would carry serious momentum implications.
The Macro Wildcards
What Breaks the Resistance?
For the bulls to win this battle decisively, three things need to happen — and two are already in motion.
First, a weekly close above $80,000. Intraday wicks mean nothing. A sustained weekly close above this level tells the market that buyers absorbed the selling pressure, held the line, and established a new floor. Every major BTC trend change in 2025 and 2026 started with a weekly close above or below a key moving average — not a brief intraday spike.
Second, sustained ETF inflows. The institutional bid needs to hold. Weekly inflows above $500 million signal that real capital is committed and not retreating at the first sign of resistance. The April and early May data suggests this condition is close to being met.
Third, a macro catalyst. Whether it is a dovish signal from the incoming Fed leadership, a breakthrough in U.S.-Iran negotiations, or progress on stablecoin legislation, Bitcoin needs a narrative tailwind to break through a wall that has held for seven months. The technical setup and the positioning are both primed. The trigger is what’s missing.
Strategy (formerly MicroStrategy), which holds 818,334 BTC, is set to report Q1 2026 earnings on May 5. Any change in its accumulation posture — or any signal that it is resuming purchases — could shift sentiment materially and quickly.
The Stakes
If Bitcoin breaks and holds above $80,000 on a weekly close, the next target is clear: $84,500–$85,000, the confluence of the 200-day simple moving average and the upper boundary of the January consolidation range. Beyond that, analysts see $88,000–$96,000 as entirely plausible within weeks, given the supply constraints and institutional demand dynamics.
If it fails? A pullback to $75,000 is the first support. A break below $72,000 opens the door to a retest of the $70,000 zone and potentially the 2026 low near $60,000.
The bears are not wrong to be cautious. But they are crowded, leveraged, and sitting directly beneath a loaded spring. In markets, that is a dangerous place to be.
$80,000 is not just a number. It is the line between a recovery and a rout — and right now, the evidence suggests the bulls have more ammunition than the bears realize.
The post Bulls Eye $80K, Bears Push Back: What Could Break Bitcoin’s Most Stubborn Wall? appeared first on NFT Plazas.
You Might Like