
Bitcoin Reclaims the 5-Day 200: 67% Green a Month Later
- Views: 4

This post was originally published on this site
📅 Recorded Thursday, October 22, 2026 (from that day’s daily analysis). Prices and levels are as of that date.
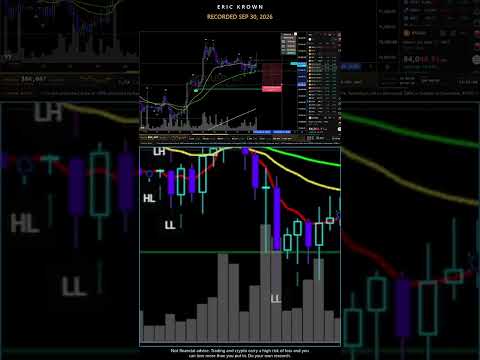
New: a 5-day candle closing back above its 200-bar moving average after closing under it. Tonight’s line is $82,081 on the TradingView index ($82,100 on my chart). Ten priors since 2015: a month later 67% green, the green ones +11.4%, the red ones -11.3%; six months later 89% green.
The full video — is Bitcoin faking us out? My two lines, tonight’s 5-day close, the new 5-day 200 SMA table, the golden cross roadmap, the S&P into year-end:
→ https://youtu.be/8cC9Jpc8D5c
📗 FREE: My Complete TA Ultimate Beginners Program
→ https://krown-trading.teachable.com/p/ta101
Educational content only. Not financial advice.
#shorts #bitcoin #trading
You Might Like