Bitcoin Volatility Just Hit a 2-Month Low – With the Worst News of the Year
- Views: 1


This post was originally published on this site
Bitcoin implied volatility just hit its lowest level since May 31 – at the same
time the news flow turned as bad as it has been all year. July spot ETF inflows
were the lowest monthly total on record, the first US spot Bitcoin ETF is
winding down, the Fed held 9-3 with three votes for a HIKE, Strategy sold 1,638
BTC below its own cost basis, and Fear & Greed sits at 25. Every one of those is
a reason for price to be lower. Price is flat.
⬛ Build Your Own AI Trading Agent For FREE — Full Tutorial
→ https://krown-trading.teachable.com/p/cpro
📗 FREE: My Complete TA Ultimate Beginners Program
→ https://krown-trading.teachable.com/p/ta101
🟪 Kalshi Prediction Markets: Trade $50 & Receive Up To $500 Credit
→ https://kalshi.com/r/erickrown
🔵 COINBASE: $250 Deposit Bonus + 80% Trading Fee Reduction
→ https://coinbase.com/aff/krown
▬▬▬▬▬▬▬▬▬▬▬▬▬▬▬▬▬▬▬▬▬▬▬▬▬▬
🟧 Trade on ByBit (Inverse Perps & High Liquidity)
→ https://partner.bybit.com/b/Cave
⬛ BloFin (No KYC + 15% Discount)
→ https://partner.blofin.com/d/Reduction
⚡ META SIGNALS — Code KROWN for 10% Off
→ https://metasignals.io/nft
▬▬▬▬▬▬▬▬▬▬▬▬▬▬▬▬▬▬▬▬▬▬▬▬▬▬
🏔️ Join the Cave (Discord)
→ https://discord.gg/3PJDRbYw44
▬▬▬▬▬▬▬▬▬▬▬▬▬▬▬▬▬▬▬▬▬▬▬▬▬▬
ABOUT THIS CHANNEL
Eric Krown is a former NYSE ARCA options market maker with 15+ years of experience. This channel delivers daily Bitcoin and macro market analysis using a systematic five-layer framework: Trend, Volatility, Structure, Momentum, and Risk — the same methodology used on the trading floor. No hype. Data-driven analysis with proof of trade.
This content is for educational and entertainment purposes only. Not financial advice. Trade at your own risk. Do not trade on any exchange that prohibits trading from your geographical region.
#Bitcoin #Stocks #investing
0:00 The one line that decides Bitcoin
0:14 Implied volatility at a 2-month low vs the worst news of the year
0:48 Why markets bottom on bad news
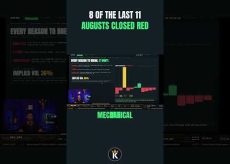
2:16 August seasonality: 8 of the last 11 closed red
2:46 The part the seasonal chart cannot show you
3:08 The line in the sand: $64,502 CME close
4:32 IBIT hidden bullish divergence
5:00 The 2-day 5/21 EMA setup and the 55 EMA target
6:36 8-day timeframe: first cross since February
7:35 Prediction markets on tonight’s CME close
9:15 8-day Revin Ribbons midband at $68,500
10:09 Closing the $66,500 calls
11:18 Traditional markets: S&P and Nasdaq futures
12:45 Coinbase Advanced and the daily DCA
14:34 The takeaway
You Might Like