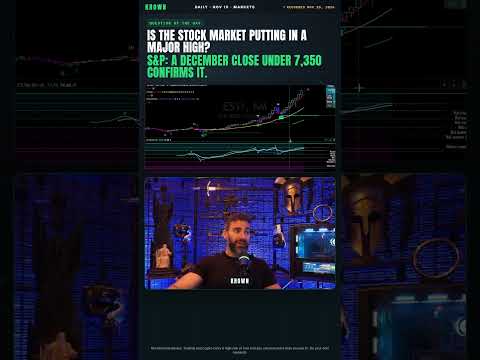
The S&P’s Line by December: 7,350. Its RSI Was Last Here in 2021
- Views: 3

This post was originally published on this site
📅 Recorded November 10, 2026 — numbers pertain to that date.
The S&P futures quarterly chart has a possible bearish divergence if this is a local high; a December close under about 7,350 confirms it. The six-month RSI is at a level last seen at the 2021 highs.
The full video:
→ https://youtu.be/78k4GmOT2KE
📗 FREE: My Complete TA Ultimate Beginners Program
→ https://krown-trading.teachable.com/p/ta101
#shorts #stocks #stockmarket
DISCLOSURES
General market commentary and education, not personalized investment advice and not a recommendation to buy, sell, hold or size anything. I am not a registered investment adviser or commodity trading advisor. I may hold positions in assets discussed. Trading carries substantial risk of loss; statistics and backtests are hypothetical and do not predict results. Some links are affiliate links. Consult a licensed professional before acting.
You Might Like